BCS L4 Data Analysis Exercise 4

  1. What does the term ‘data profiling’ mean? 
    Data profiling is the process of examining data from available sources to confirm that it is suitable for analysis and highlight any quality issues.  This can involve applying statistical tools, extracting metadata, checking ranges are as expected, checking consistency between datasets and identifying probable key values and relationships. 

    A data profiling tool may be used to profile the data and, in some cases, may use business rules provided by the user to expose any problems such as illegal values (e.g. a field may only have legal values of Y or N but some rows contain X due to sloppy validation in the source application or OCR errors, a NOT NULL field contains NULL values for some rows or a field with a UNIQUE constraint contains duplicate values), out of range errors (e.g. a numeric field can only have values between 0 and 100 but some rows contain negative values), unmatched references (e.g. a product code field on the orders data must match a product code in products data) &c.  Depending on the target system these errors may cause data to fail to upload or may cause analysis to give incorrect results.
  • Data usually goes through a cleansing process in preparation for data analysis. The purpose of this process is to remove/correct inaccurate or corrupt records to improve data accuracy and quality.

When an error or issue is found in the cleansing process which causes the data values not to be accepted, the following decisions must be made:

  • Do we accept or reject the data?
  • Do we correct the error?
  • Do we create a default value?

Please explain in more detail

A data analyst may choose to load the erroneous data if the impact is small and the rest of the data in the rows is still useful and unlikely to be impacted by the error.  Alternatively they may reject all rows containing erroneous data if an error in one field means that other fields in the same row are likely to also be errors and/or if the impact of the erroneous data on the final analysis is likely to be greater than the impact of just excluding the rows.  The decision to accept or reject the data may depend on an in depth knowledge of the systems and datasets involved.  It should be documented and the source of error investigated to minimize future reoccurrence.

Correcting erroneous data primarily depends on if the correct value can be determined to within an acceptable degree of accuracy to an acceptable certainty, and the risk of an inaccurate value is deemed preferable to using a known erroneous value or blanking the field.  There are a number of potential ways to determine the correct value, depending on the data set and the field, if other fields in the same row can be used to identify the value then that may give a high level of confidence as to what the value is (e.g. if someone has selected the title Mrs, Miss or Ms then there is a very high probability that the Sex field should be Female, if they selected Mr then the Sex field should probably be Male and if they selected Mx then the Sex field should be Prefer Not To Say, any other titles may be best classified with Sex as Unknown), similarly it may be possible to infer the correct value from other records relating to the same entity or transaction.  How the correct version (within an acceptable error margin) is determined will rely on an understanding of the data and understanding the potential impact of getting it wrong.  ‘Corrected’ data should not be written back to the source systems, in particular for living individuals, but if practicable should be notified to the owners of the source systems, due to the General Data Protection Regulation which requires that data about an individual be kept current and accurate.

Sometimes it might be more useful to replace erroneous data with a default value.  This might be used when the row as a whole is needed but there is no practicable way to infer the correct value and it is important to have a value in that field but less of a problem if that value is not the original (e.g. if the field is counted or averaged many systems will ignore rows where the field being used is null).  The value used could be a fixed value or it may be more useful to use a calculated or random value.  Examples of calculated values for numeric fields might the median, mode, maxima or minima of the field in rows where it is not an error.  For non-numeric fields with a small number of different possible values (e.g. Sex) one might randomly assign one of the possible values or insert them in a repeating sequence.

Obviously, before settling on a method to handle erroneous values you would need to assess the potential impact, based on your understanding of the data, that each would have on the results.  If the analysis is to be repeated then the assessment should typically include identifying the source of the errors and recommendations on how to avoid reoccurrence.

  • A Data Quality (DQ) Dimension is a recognised term used by data management professionals to describe a feature of data that can be measured or assessed against defined standards in order to determine the quality of data.

There are six dimensions of data quality:

  • Completeness
  • Uniqueness
  • Timeliness
  • Validity
  • Accuracy
  • Consistency

Please explain in more detail

  • Completeness refers to all the required data being provided.  Data can still be complete if optional data is missing but all mandatory fields must be present in every record.
  • Uniqueness of data requires that there be no duplication of data, i.e. records that occur more than once.  This can be an issue where two datasets are merged which have some data in common, e.g. quarterly sales data reports are merged to create an annual sales report but due to an error in the extraction routine the last day of one quarter is repeated as the first day of the next quarter.  It can also be a problem where the same record at different points in time appears in different extracts that are then merged.  For example in an order processing system the order record may be created with a status of  new, move to placed, then to confirmed and so on to closed.  A regular data extract that extracts all records or all records updated since the last extract may have instances of this record at different statuses in different dataset extracts.  If these datasets were merged then a simple deduplication routine (such as you might apply in the first example) may not work as the records in toto are not identical.  To ensure uniqueness in this situation some sort of reliable unique key and timestamp would be needed so the deduplication routine can return only the latest version of each record based on the unique key.
  • Timeliness requires that the data be available/supplied when needed.  For example if a report is needed for a meeting and will take a week to build then the data must be supplied at least a week before the meeting.  It can also cover the data needing to be the correct data for the period being reported on, e.g. if the report is about March then you do not want data about February to be submitted instead.
  • Validity means that the data is in the correct format (or where this is not possible can be converted to the correct format) and units.  Common issues here are different parts of the business report the same data in different formats or units due to tradition or national conventions, for example dates in most parts of the world are recorded as DD/MM/YYYY but in the US are typically recorded as MM/DD/YY.  A common issue in Data Warehousing, where historical data may be stored, is that the unit of measure changes.  Specifically for the date format issue, many systems avoid this internally by storing dates as a number of days since a known point in time (often 1st January 1900 or 1st January 1970) but data transferred between systems may suffer from date format differences.  This might be a change from imperial to metric measures (e.g. a product that used to be sold in packages of 1lb is now sold in packages of 500g, 1lb = 453.6g) or where changes to the source systems means that data that used to be reported as single items are now reported combined items or visa versa (e.g. a stock control system that used to record baked beans by the number of cans now records the number or 48 can cases).  Where issues of validity occurred the data analyst must identify and execute a strategy to resolve these and ensure that all data is in the same format.
  • Accuracy looks at how well the data reflects the real world.  Does it correctly model the real world objects or events that it should?  This can often be confirmed by taking a representative sample of data and measuring it again or, if that is not possible, using triangulation methods (use 2 existing observations to predict a third and confirm the prediction is correct) or comparing with past data sets to ensure that any changes are with expected ranges.  It can also cover ensuring that text fields are spelled correctly, that postal/zip codes match the associated address &c.
  • Consistency covers ensuring that data from different sources matches the same underlying situations (if one dataset predicts a truth then other datasets predict the same truth).  For example if a person’s HR record shows that they have been dismissed then the payroll should not contain a payment record for them and their login account on the network should be disabled, similarly if a project is marked as closed in the project management system then there should be no entries in the timesheet system logged against that project.

Suggested websites

https://datacadamia.com/data/quality/profiling#description

https://datacadamia.com/data/quality/data_correction

BCS L4 Data Analysis Exercise 3

  1. All programming languages utilise program constructs. In imperative languages they are used to control the order (flow) in which statements are executed (or not executed).

 Describe and give examples of the following programming constructs:

  • Sequence (top down processing)
    Statements are executed in the order in which they appear in the code.

    e.g. the code:

    printf(”Hello,”);
    printf(“ World\n”);

    will output Hello, World.
    • Selection (also known as branching)
      Which commands are executed depends on some condition, such as the value of a variable.

      e.g. the code:

      if(guess==answer) {
          printf(“Correct”\n”)
      }
      else {
           printf(“Wrong, try again\n”);
      }

      compares the values of two variables (guess and answer, classically this will be a simple game where a player guesses a random number), if they are the same (the guess is correct) then the code outputs Correct, if they are different then the code outputs Wrong, try again

    • Repetition  (also known as iteration or looping)
      The same commands are executed multiple times, either a fixed number of times or until some condition is met.

      e.g. the code:

      for(i=0; i=9;i++)
      {
      printf(“Step %i\n”);
      }

      will print the numbers 0 to 9 then stop.
  • Explain the following programming terminology
    • Modularisation or modular programming
      Functionality of a program is divided into separate modules containing related functions/procedures with documented interfaces between them.  This encourages reuse of code, rather than including the code to perform an action every time it is needed one standard function or procedure can be called, and allows multiple programmers to work on the program at the same time as each module will be a separate source code file.  In many modern operating systems modularization supports dynamically loaded libraries where the code for a function is not loaded unto memory until it is needed, so minimizing the amount of memory used for running program code.
    • Coupling
      Coupling refers to how tightly two different modules are dependent.  The more tightly they are coupled the more difficult it can be to reuse independently and the more likely that changes to one will require changes to the others.  Generally coupling should be minimized.
    • Cohesion
      Cohesion relates to how closely the functions in a module are related.  At the lowest level there is little or no relationship between functions, any relationship is purely coincidental, at the other extreme all functions in a module may be used to deliver the same process.
  • Each column in a database table is required to have a name and datatype. The datatype is a guideline for SQL to understand what type of data is expected inside of each column. It also identifies how SQL will interact with stored data.

 There are 3 main data types:

  • STRING
    • NUMERIC
    • DATE and TIME
  • Give 2 examples of a STRING datatype
    CHAR(N) – A fixed length string of characters in the default character set for the database, a variation of this is NCHAR(N) which uses the National Language Character Set for the database.  The length is set by the number in parenthesizes.  As these are fixed length character types they are best suited to strings that are similarly fixed in length (e.g. an invoice reference with a fixed format) to minimize wasted space which may impact performance, although modern enterprise database systems will often silently convert CHAR(N) fields to VARCHAR(N) in the background.  In some older technologies which may still be in use for legacy systems, the CHAR(N) datatype may only be store characters that map to the 8 bit ASCII/ANSI character set values (0-254) so may not be able to store larger charactersets such as UNICODE, this can be resolved by using the NCHAR(N) datatype, if available.
    VARCHAR(N) – A variable length string of characters in the default character set (or for NVARCHAR(N) the National Language Character Set) for the database.  The maximum length is set by the number in parenthesizes, some database systems implement the use of the word MAX as an alternative to setting a maximum size which defaults to the maximum size permissible for the platform.  Due to it’s variable length this is suited to most character string data such as names, descriptions, addresses (or parts of addresses) or any string where you do not know how long it will be or the length may vary greatly.
  • Give 2 examples of a NUMERIC datatype
    INT – An integer (whole number) value.  Often this will be split into short and long integers and signed (can be above or below zero) and unsigned (zero or greater only).  The maximum value that can be stored in each is determined by the platform.  INT datatype can be used for any numeric value that has no fractional part. In particular countable objects.
  • FLOAT/DOUBLE – A decimal number (i.e. one that can have a fractional part) stored as a multibyte construct.  The number of bytes determines the size of number that can be stored, based on the precision (number of significant digits), DOUBLE is typically implemented as FLOAT with a high precision.  Larger numbers will usually be depicted in scientific notation (N*10^E).  FLOAT/DOUBLE datatypes can be used for any numerical value in particular where a fractional part is needed such as currency, weights or other measurements or where the value is outside the range supported by INT.  If the fractional part is not needed then an INT type should be used if the value falls in the supported range, as they typically require less memory to store.

Give 2 examples of a DATE and TIME datatype

  • DATETIME/DATE/TIMESTAMP – Represents a calendar date, with or without time element.  Due to differing formats for dates in different regions dates are typically stored as numeric value, counting seconds or, more usually, fractional seconds since a fixed point in the past, which date varies from system to system common examples are 1st January 1900, 1st January 1000, 1st January 1970 (the UNIX Epoch) or 14th September 1752 (when the UK switched from the Julian to Gregorian calendar).  TIMESTAMP is a special case of DATETIME and often has system level rules associated with it.  Typically, a field of TIMESTAMP would not be updated by the application but by a trigger or similar on the table to provide a record of when a field was last updated.  Dependent on the system DATE may be a separate datatype or may just be a synonym for DATETIME.  DATE/DATETIME/TIMESTAMP are suited to storing calendar dates such as dates of appointments, anniversaries, events &c.  They are not generally well suited to storing elapsed time such as time between events or how long some thing has lasted, in particular where the start and end may be on different calendar days, or there is a chance of a negative value.   These are usually better stored as a FLOAT or INT and custom processing/formatting used to output the results.
  • TIME – Implementation of this datatype varies from system to system so care must be used.  In many cases (Microsoft Excel being a common one) it is a DATETIME but the date portion is ignored so 12.5 hours plus 12.5 hours will give a result of 1 hour, not 25, as it will have carried 24 of the hours to the days element.  In most cases this can be worked around by applying formatting to the output of the calculation (e.g. in Excel selecting the Time format (hh:mm) for a field will display the result of the above calculation as 01:00 but using a custom format of [hh]:mm will display 25:00).  Alternatively TIME may be implemented as a numeric type, usually number of seconds, with custom formatting for output.  It may be suited to holding elapsed time.
  • There are numerous SQL commands for manipulating data.
    • What would be the reason for using the SELECT statement?
      A select statement is mostly used to extract data from one or more tables.  Some database management systems support SELECT FOR UPDATE as part of transactional integrity.  This is particular useful for forms based applications where a user may need to update a specific record but it might take some time.  Using SELECT FOR UPDATE locks the record(s) to prevent other transactions being able to update them until the transaction is either committed or rolled back.  This can cause problems if the query is not specific enough as if you lock too many records (generally due to poor application design and/or developers who don’t understand multiuser databases) then this can cause other transactions that need to update a locked record to wait until the locking transaction is committed or rolled back.

Please provide an example of a SELECT statement and an example of a SQL command using the FROM clause
select a.Asset_tag

, a.Allocated_User

, a.User_ID

, a.Last_logged_on_user_name

, a.Last_Logged_On_User_ID

, a.Most_Frequent_User_Name

, a.Most_Frequent_User_ID

, a.Directorate

, a.Division

, a.Section

from dbo.HW a

  • What would be the reason for using the SELECT * statement?
    SELECT * returns all columns in a table in the order they appear (typically the order they were in the initial create table command).  You would use this where you want to get all of the data in a table such as to export to a text file or to back up a table before carrying out a change

Please provide an example of a SELECT * statement

Select * from emp

Create table emp_backup as select * from emp

Give an example of a SQL command using the WHERE clause
select [Asset_tag], State, Substate, [Allocated_User], Division, Section, [Operating_System], b.mail, Model

from HW4 a

left outer join allocated_Email b on (a.[User_ID] = b.[User Name])

where Directorate = ‘Capita ICTDS’

and Division not in (‘Link2ICT’)

order by [Allocated_User]

  • When we combine logical operators such as AND / OR / NOT with the WHERE clause, these are known as compound conditions

Give an example of a SQL command using the AND clause
select [Asset_tag], State, Substate, [Allocated_User], Division, Section, [Operating_System], b.mail, Model

from HW4 a

left outer join allocated_Email b on (a.[User_ID] = b.[User Name])

where Directorate = ‘Capita ICTDS’

and Division not in (‘Link2ICT’)

order by [Allocated_User]

Give an example of a SQL command using the OR clause
select asset_tag, model, model_category, Manufacturer, directorate, division, Section, User_ID, Most_Frequent_User_ID, Last_Logged_On_User_ID

from HW

where User_ID like ‘kios%’

or Most_Frequent_User_ID like ‘kios%’

or Last_Logged_On_User_ID like ‘kios%’

or User_ID like ‘Kios%’

or Most_Frequent_User_ID like ‘Kios%’

or Last_Logged_On_User_ID like ‘Kios%’

Give an example of a SQL command using the NOT clause
select GETDATE() as Date, max(DaysOpen) as OldestOpenCall

from EngineerCallTracking

where State not in (‘Resolved’, ‘Closed’)

select GETDATE() as Date, max(DaysOpen) as OldestOpenCall

from EngineerCallTracking

where State != ‘Resolved’

  • Why would we use the LIKE operator in a SQL command?
    The like operator is used with wildcard characters to filter records that contain a particular string  of characters. 

 Give an example of a SQL command using the LIKE operator

select asset_tag, model, model_category, Manufacturer, directorate, division, Section, User_ID, Most_Frequent_User_ID, Last_Logged_On_User_ID

from HW

where User_ID like ‘kios%’

or Most_Frequent_User_ID like ‘kios%’

or Last_Logged_On_User_ID like ‘kios%’

or User_ID like ‘Kios%’

or Most_Frequent_User_ID like ‘Kios%’

or Last_Logged_On_User_ID like ‘Kios%’

  • List at least 3 wildcard characters and explain their usage.
    The exact wild card characters used vary from DBMS (database management system) to DBMS.  The ISO standard specifies only 2 wildcards (‘%’ and ‘_’) but others are implemented by different DBMS.
    %/* – Matches any zero or more characters, often used when you are looking for a string within another string e.g. ‘Fred%’ will match any string that starts with ‘Fred’ so will match ‘Fred’, ‘Fred ‘, ‘Fred Bloggs’ and ‘Frederick Bloggs’ but not ‘Bloggs, Fred’, but ‘%Fred’ will match ‘Fred’ and ‘Bloggs, Fred’ but not ‘Fred ‘, ‘Fred Bloggs’ and ‘Frederick Bloggs’
    _ – Matches any one and only one character so ‘Fred_’ will match any string  starting with Fred and followed by any single character so will match ‘Fred ‘ but not ‘Fred’, ‘Bloggs, Fred’, ‘Fred Bloggs’ and ‘Frederick Bloggs’. 
    [] – Matches any occurrence of one character between the square brackets.  E.g. ‘Fr[eo][dg]’ will match ‘Fred’ or ‘Frog’ (it will also match ‘Frod’ and ‘Freg’ but not being words in the English language they should not appear, presuming the string is in English)

  • Why would we use the keyword ‘ORDER BY’ in a SQL command?

Please provide an example

Order by sorts the columns specified so would be used any time the order of the data is important for example when you want similar items to appear together, lowest price to highest price, most expensive to cheapest &c.  By default sorting will be ascending (alphabetical/smallest to largest) but this can be switched to descending (reverse alphabetical/largest to smallest) by adding ‘desc’ following each field you wish to reverse the sort order for.

  1. A function is a predefined formula which takes one or more arguments as input then processes the arguments and returns an output.

There are two types of SQL functions

  • aggregate functions
  • scalar(non-aggregate) functions

An SQL aggregate function calculates on a set of values and returns a single value. For example, the average function ( AVG) takes a list of values and returns the average.

Describe the following aggregate functions giving examples

  • COUNT – returns the number of rows returned by a query.  Count(*) or count(1) will return the total number of rows whilst count([field name]) will return the number of rows where the field identified by [field name] is not null.  select count(*) from sales;
    • AVG – return the average (arithmetic mean) of the values of a numeric field.  Select avg(price) from sales;
    • SUM – returns the total of the values of a numeric field.  Select sum(price) from sales;
    • MIN – returns the minimum of the values of a numeric field.  Select min (price) from sales;
    • MAX – returns the maximum of the values of a numeric field.  Select max(price) from sales;
  1. Because an aggregate function operates on a set of values, it is often used with the GROUP BY clause of the SELECT statement. The GROUP BY clause divides the result set into groups of values and the aggregate function returns a single value for each group.

 Describe the GROUP BY statement giving examples

The group by clause must include all non-aggregated fields used in the query, e.g.

Select product_category, date_of_sale, sum(price) as sum_of_sales

From salesInventory

Group by product_category, date_of_sale;

Group by carries out an implicit sort on the data, however this should not be relied upon.

  1. Non-aggregate or scalar functions operate on each record independently

These functions are based on user input and return a single value

Describe the following non-aggregate functions giving examples

  • ROUND() – Rounds a number up or down to the specified number of significant figures, e.g. round(3.1415, 2) will give 3.14 and round(3.1415) will give 3.142
  • CAST() – Converts from one data type to another, e.g. cast(‘1234’ as int).  This is useful where different systems might store the same data in different types, or the Export/Import process may have carried out an implicit conversion incorrectly, and you now need to compare them, for example where one system stores invoice numbers as an integer and another as a string.
  • CONVERT() – Converts from one datatype to another, e.g. convert(nvarchar(9), today(), 103) will return a text string in the dd/mm/yyyy format.  Convert() differs from Cast() in that you can use the optional third parameter to specify the format of the data.
  • ISNULL() – returns true if the field is null and false if it is not null, e.g. isnull(Complete).
  1. 13.  What is the meaning of ‘implicit data conversion’?
    If using fields of two diffe
    rent data types in a calculation/comparison then one will, if possibe, be converted by the software to the datatype of the other.  E.g. if adding an integer to a float the integer will be promoted to a float and then the addition will occur. 

  1. There are many built-in functions in SQL to do various calculations on data.

Describe the following built-in function giving an example

CASE

Case replaces lengthy if…the…else if…then…else… statements where you need to branch in a variety of possible ways based on the value of a variable. 

e.g.
set @RetValue =

       case

              when @outcome = 0 then ‘None OK’

              when @outcome = 1 then ‘Processor OK, Disk and RAM not OK’

              when @outcome = 2 then ‘Disk OK, Processor and RAM not OK’

              when @outcome = 3 then ‘Disk and Processor OK, RAM not OK’

              when @outcome = 4 then ‘RAM OK, Disk and Processor not OK’

              when @outcome = 5 then ‘RAM and Processor OK, Disk not OK’

              when @outcome = 6 then ‘RAM and Disk OK, Processor not OK’

              when @outcome = 7 then ‘All OK’

              else ‘Something broke’

       end;

Each comparison is executed in order, so if more than one is a match the first will be the one taken, until a match is found or the else statement is reached, the else statement is executedif no match is found.

  1. A SQL expression is a combination of one or more values, operators and SQL functions that evaluate to a value. These SQL EXPRESSIONs are like formulae and they are written in query language. You can also use them to query the database for a specific set of data.

There are 3 different types of SQL expressions

  • Boolean
  • Numeric
  • Date

Please give an example of a SQL Boolean expression

Select employeeName from emp where Salary =10000;

Select userRoleTitle from users where username = ‘fred’;

Select employeename, startdate from emp where endDate is not null;

Please give an example of a SQL Numeric expression

Select 2 + 3 from dual;

Select employeeName, salary + bonus as totalIncome from emp;

Please give an example of a SQL Date expression

Select today() from dual;

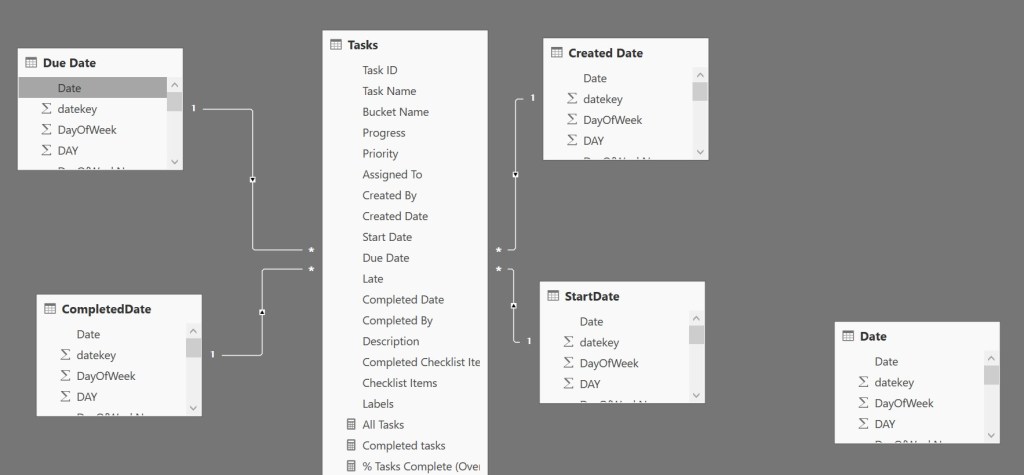
  1. A JOIN clause is used to combine rows from two or more tables, based on a related column between them

Describe and give examples for the use of the following JOIN keywords

  • INNER JOIN – Joins two tables and returns those rows where the key value used appears in both tables, e.g. select a.product_name, a.RRP, b.DateOfSale, b.SaleQuantity from product_catalogue a inner join sales_ledger b on (a.sku = b.sku); will return all those products in the catalogue table for which there is at least one sale and the date and quantity of each sale.  It will not return any products with no sales or any sales that do not match a product in the catalogue.
  • LEFT JOIN – Joins two tables and returns all rows in the table to the left of the join and any matching rows in the table to the right of the join with null values in the sales related fields for those products without sales, , e.g. select a.product_name, a.RRP, b.DateOfSale, b.SaleQuantity from product_catalogue a left join sales_ledger b on (a.sku = b.sku); will return all products in the catalogue, even if they do not have any sales, and just those rows in the sales table that match a product in the catalogue.  It will not return any sales that do not match a product in the catalogue.
  • RIGHT JOIN – Joins two tables and returns all rows in the table to the right of the join and any matching rows in the table to the left of the join with null values in the product related fields for those sales that do not have related products, , e.g. select a.product_name, a.RRP, b.DateOfSale, b.SaleQuantity from product_catalogue a right join sales_ledger b on (a.sku = b.sku); will return all rows in the sales table even if they do not match a product in the catalogue and only those products that have at least one sale.  It will not return any products that do not have sales.
  • FULL JOIN – Joins two tables and returns all rows in both tables with null values in the appropriate fields for those products that do not have sales and for those sales that do not have associated products, , e.g. select a.product_name, a.RRP, b.DateOfSale, b.SaleQuantity from product_catalogue a full join sales_ledger b on (a.sku = b.sku);. Will return all rows in the catalogue table that do not have sales, all rows in the catalogue table for those products with sales and the associated sales information and all rows in the sales table that do not have associated products in the catalogue.
  1. When would we use the UNION operator?

UNION is used to merge the output from two queries (usually with the same structure) into a single output, removing any duplicate rows.  It might be used where you have a working transactions table where periodically, for performance reasons, old transactions are moved into an archive table and you wish to get results from both as a single output.

Please give an example

select a.product_name, a.RRP, b.DateOfSale, b.SaleQuantity from product_catalogue a inner join sales_ledger b on (a.sku = b.sku) where a.product_category=’BOOK’

UNION

 select a.product_name, a.RRP, b.DateOfSale, b.SaleQuantity from product_catalogue a inner join sales_ledger_archive b on (a.sku = b.sku) where a.product_category=’BOOK’

  1. When would we use the SELECT INTO clause?
    Select into is used to copy data from one table to another.  This is particularly useful if you want to take a sample of table to test a script or back up a table before an update incase you need to recover from a problem.

    Please give an example

Select * into newUsersTable from usersTable

  1. When would you use the following SQL keywords?

Please give examples

  1. TOP – Limits the output to the top N rows of the output, often used with an order by clause.  This is not supported by all database management sytems, e.g. select top 10 product_name, numSales from sales_volumes order by numSales;
  2. LIMIT – Similar function to TOP implemented in MySQL, which does nto support TOP, e.g. select product_name, numSales from sales_volumes order by numSales limit 10;
  3. ROWNUM – Used in Oracle, ROWNUM is a pseudo-variable the identifies where a row appears in the output from a query, it can be used in a where clause to simulate TOP, e.g. select product_name, numSales from sales_volumes order by numSales where rownum< 11;  It can also be used where you are interested in a specific row in the output or range of rows (e.g. on a message board where there are 25 messages listed per page so for page 3 you want rows 51 to 75.
  • Explain the term SQL Subquery and the rules that a subquery must follow
    A SQL subquery is a query within a main query where the output of which is fed into the main query.  They can be used anywhere an expression can be used subject to certain rules such as if used in a where clause the field datatype the output must be of a compatible type with the field to which it is compared, the output cannot contain certain large datatypes (e.g. image, blob &c) and the order by clause cannot be used except to enable a top clause to be used.

Please provide an example of a subquery

Select devicename, assigneduser

From devices

Where assigneduser not in (select username from emp where location=;’WFH’);

Suggested websites

https://www.w3schools.com/sql/default.asp

https://www.tutorialspoint.com/sql/index/htm

https://www.techonthenet.com/sql/index.php

BCS L4 Data Analysis Tools Exercise 2

  1. Data can be filtered or refined to ensure that only the relevant data is integrated.
  2. Describe a situation where data has been filtered to underpin a business objective.
    A common technique in marketing is A/B testing where different customers are randomly given different offers on a product, e.g. one group are offered a discount whilst another is offered buy-one-get-one-free.  This is particularly powerful in online stores where customers are not limited geographically (in bricks-and-mortar stores each store can only give one of the offers so it may be that a particular offer works or does not due to the area, useful information but it may mask other useful information) and the business is likely to have other data about the customer such as demographics.  The business will filter the datasets on views and sales by which offer the customer was given to compare the impact on buying decisions vs other metrics such as age, gender &c.  This can be used to tune future sales algorithms to offer the deal most likely to get the person to buy.
  3. Name 3 business objectives that could be better understood by filtering data ie improve customer satisfaction
    I really struggled with this question, I don’t think I understand what it’s asking for.

    Increase sales in an underperforming region by filtering datasets to just that region
    Reduce customer complaints by filtering datasets on the best ten and worst ten sites into two separate datasets to allow you to focus on the differences that may be lost in a larger dataset.
    ?

    Reduce costs by identifying under performing business units and product lines and focusing on them.
    Increase sales by comparing high performing regions with low.
    Reduce staff absence by identifying trends.
  • Data integration techniques can be categorized as follows:
  • Manual Integration or the Common User Interface
  • Application Based Integration
  • Middleware Data Integration
  • Virtual Integration or Uniform Data Access
  • Physical Data Integration or Common Data Storage
  1. Explain the Manual data Integration technique and describe the following Common User Interfaces
  2. Dashboard
  3. Scorecard
  4. Dynamic charts

    Manual integration involves a person manually combining, filtering and summarizing data from different systems.  Commonly this will be taking spreadsheets, CSV files etc and loading them into a spreadsheet program (e.g. Excel) or desktop database (e.g. Access) then using lookups and formulas to process the data ready for visualization.  This is most useful when the analysis is a one off so is not worth the effort of automating and for exploratory or pilot analysis where you are looking for options or the end user is unsure what they want and wants the data analyst to show them the ‘art of the possible’.

    A dashboard is a collection of visualizations, typically on a single page, that provides a high level summary view of the data.  The visualizations may be collated from one or more separate reports.  The aim is to provide an overall indication of the situation, ‘At A Glance’, without going into detail, although an online dashboard may provide the ability to drill down to more detailed visualizations and the underlying data.

    A score card is a form of dashboard that compares actual values to a target or predicted value.  For example you may not be concerned about the specific sum spent per department each month, just if it is within a given tolerance of the budgeted amount so, if your tolerance is 5%, you might use a RAG status with Green for upto +/- 5% of budget, Amber for +/- 5-10% of budget and Red for +/- over 10% and apply the colours to arrows representing which direction.  This quickly draws the readers attention to those areas most in need of attention.

    A dynamic chart is a chart that is connected to some sort of data feed and updates either on a set frequency or when triggered by a change in the feed.  They may show a current status or a rolling average.  These are commonly used in IT to display the status of key servers and network links, often with colour coding to highlight potential problems.  Similarly they are often used in call centres to show metrics important to the minute by minute management of the centre.  Typically they may show a breakdown of number agents in calls vs in wrap up vs waiting for calls vs logged off, current call volumes vs callers in queue vs callers on hold, current longest call, average call length as a rolling average for the past hour &c.
  5. Explain the Virtual data integration technique
    Virtual Data Integration uses direct links to the source systems, often via views or ‘canned queries’ that connect using database links or an API (Application Programming Interface), to get data for analysis when it is needed.  These have the advantage that you are always looking at the most current data and do not need to keep extra copies of the data.  Key disadvantages are that you may not be able to view historic data, version control can be challenging as the same report run by different people seconds apart may give different results and running reports will place extra load on the source system.  This last can be a major issue on high volume transactional systems as they are tuned for transactional work, typically many small updates with few queries, and those queries are often using indexed key values, where are reporting and analysis will often involve long running queries that often use full table scans.
  6. Explain the Physical data integration technique and describe the following process
  7. ETL

Physical data integration is taking datasets from source systems and moving it to a dedicated reporting/analysis platform, often a datawarehouse or datamart.  This process is often referred to as ETL, Extract Transform Load.  The Extract phase involves taking a copy of the data from the source systems and putting it in a staging area, the data may be filtered at this phase, commonly to just new data since the last extract as previous data may already be on the target platform.  During the Transform phase the data is manipulated to make it more suitable for reporting.  This often involves denormalization, creation of summary values and data conversions (e.g. a multinational company may convert all transactions to a single currency and store that alongside the actual transaction value in the original currency).  The Load phase involves moving the dataset onto the reporting/analysis platform.  This could be database tables, a spreadsheet, an OLAP (OnLine Application Processing) cube.  Often this will also involve creating objects such as indexes and materialized views to support queries used in reports.

Suggested websites

https://www.dataintegration.info/data-integration

https://www.dataintegration.info/etl

BCS level 4 Data Analysis Apprenticeship Tools Exercise 1

Exercise 1

  1. What is the purpose of data integration?
    Data integration reduces the complexity of data by unifying multiple datasets to create a single view of the data.
  2. How does data integration:
    1.  improve the speed of analysing data?
      Integration may reduce the total volume of data to be processed by pre-excluding data not needed for the analysis (fields not needed and filtering out irrelevant data).  Integration may also include the pre-calculation of common summations, so they do not need to be calculated every time.  Similarly denormalizing the data may be used to reduce the cost of joins by taking the hit once in the ETL (Extract Transform Load) process rather than every time a query is run.  Since data for analysis may be spread across a number of line of business applications and ERP (Enterprise Resource Planning) platforms integrating the required data to a single source (e.g. a  data warehouse) will avoid the network traffic cost of database links or API calls, also the dataset for analysis can be heavily indexed to support the queries being run in ways that would unacceptably slow the transactional line of business applications.
    1.  improve timelier business decisions?
      Analytic queries tend to be very compute heavy and place a heavy load on the system which would have a negative impact on the transactional source systems, they also tend to touch most if not all of the data in a system.  Traditionally these would be run overnight or over the weekend so a decision maker wishing to investigate an anomaly in a report or run a number of What-If analyses may have to wait till the following day or even week to get their answer, on data which could be out of date.  By integrating the data to a single dataset the decision maker can drill down to focus in on the causes of anomalies or run their What-Ifs immediately on data that may be from close of business the previous day.  Immediate analysis of close to current data allows them to make confident decisions quickly.
  3. Describe the rules and policies that must in place to ensure information security in the workplace ie The CIA or AIC triad model
    CIA/AIC stands for Confidentiality, Integrity and Availability.  To maintain confidentiality users must be required to be authenticated (login with appropriate credentials; typically a username and one or more of ‘Something you know’ (e.g. password or passphrase), ‘Something you have’ (e.g. physical passkey or one time code generator, could also be access to a trusted system that supports Single Sign On) or ‘Something you are’ (e.g. fingerprint, retina scan, iris pattern, blood antigens &c).  Permissions to access data must also be graded so users can only access the data they need to access to do their job, for example someone who only needs to see reports based on their own department then they should only have permissions to see the data about their department.  Some enterprise level database management systems, such as Oracle, implement row level access control to provide this so in that example the data relating to all departments could be in the same table but those rows a person does not have permissions to see are hidden from them at the database level.  So, all user can be provided with the same report but only see the data they have permissions for.  It is good practice to assign permissions to a role and then grant the role to the user rather than directly granting permissions to a user.  Roles should be named for and associated to job roles so everyone doing the same job has the same permissions, any extra permissions granted via another role named for its purpose, and if someone changes jobs their old role(s) can be removed and new roles granted.  This reduces the risk of someone being allocated incorrect permissions or keeping permissions from an old job that they no longer should have.

    Integrity relates to keeping data accurate and up to date.  In so far as possible data should be stored only once and then referenced via key lookups, this is typically the case for a single database supporting a single application but can be difficult where multiple applications, each with their own database, all need to store the same information (e.g. multiple systems that all need to store the name and addresses of citizens).  A reconciliation process, possibly involving a Robotic Process Rutomation (RPA) system, may be needed to ensure that changes to one system are reflected into other systems storing the same data and that all systems are in step.  This may require human intervention for exceptions such as where two systems show different updates to the same data on the same day or where a data item is considered especially sensitive.  Where a data item is subject to business rules or format restrictions these should be encoded into validation processes within the application stack, ideally, this should be as close to the data as possible (e.g. via database triggers) so that if multiple applications access the same data (or batch updates are made via a third party tool) the rules will still be applied.  If a data item has an authoritative source (e.g. in the UK addresses can be looked up in the Postal Address File, PAF) then if possible that should be used to carry out a lookup to get the data.  Additionally update permissions should only be granted to those users who are required and authorized to carry out updates to minimize the risk of human error, typos &c, and auditing and transaction logging processes may be put in place to ensure that when a change is made it is evident who made the change when and what change was made (for unstructured data this might be a version control system which stores the delta (changes) between versions and who made the change that caused that delta to be created).

    Availability relates to ensuring that the data is available when required by the business.  This includes a range of factors such as ensuring regular backups are taken and can be restored in a timely fashion in event of system failure, but that the backup process does not interfere with access to the data, more recently this has focused on the use of hot backups and hot or cold failover spares but in the past meant scheduling backups for specific times of day when access wasn’t required.  For critical business systems hot failover spares (one active copy and one passive copy of the application data with updates from the active being applied to the passive copy, often by transaction log shipping, so in event of the active system failing the passive copy can be spun up and take over the processing, in some cases the log shipping may be paused each day long enough for the passive copy to be cold backed up to give an extra layer of protection) or synchronized clustering (two live versions of the application, each with their own copy of the database, are running and accessed at the same time with a backend processes to keep the databases in step, if one fails then users are moved off that one on to the other).  Similarly redundant network connections, power supply, storage &c may be called for with procedures to ensure that failures are resolved in a timely manner.  Another aspect is ensuring that hardware on which applications are run is sufficiently powerful to run the application under peak load at an acceptable speed for the users to carry out their job, similarly all layers of the stack and the links between them must have the capacity to provide a responsive service under peak load.  Users will avoid a slow application.  In the past this has mostly been handled by sizing infrastructure for the peak load of each application, with the development of cloud technologies ‘elastic provisioning’ has become common where the base specification of a virtual server is scaled for the normal load but additional resource is reserved that can be added dynamically for times of peak load.  In particular a datawarehouse may be allocated extra resources during the ETL process, which tends to be very compute and I/O heavy due to calculating summations and denormalising data, which is then dialed back for when it only needs to service queries against the denormalised data and summations.

  4. A benefit of integrating or centralising data can be that it makes the data more accessible. Explain and discuss
    When data is centralized then it is all available in one place to analysts and users, rather than having to try to go around multiple sources and people to negotiate for access, if data is not centralized then analysts may not even be aware of all data sets that might be relevant to their query.  Centralization also provides the opportunity to create a data custodian/librarian function who can provide advice and steer analysts and users to datasets that are relevant to their query and maintain master data management (MDM) to ensure that metadata and documentation of data sources are accurate and up to date to help analysts and users to be confident that the datasets are correct for their needs.  Integration of data, coupled with MDM, allows the creation of merged datasets that ensure that related data likely to be needed for the same reports is available in one dataset avoiding the need to locate and merge the data sets each time.  Obviously this would require knowing which merged sets are likely to be needed, a data custodian/librarian could monitor which data sets are requested and use this to plan what integrations need to be produced in the future.

  5. Why do we integrate data from multiple sources? What is the benefit? Provide examples of different data sources that we could integrate?

    Often related data or data about the same real-world objects, people, places &c can be stored in the different systems, possibly by different organisations.  We integrate the data to support analysis and reporting on the relationships, in particular where there may be a causal relationship between them.  Examples of this might be data on advertising spend in a region from the marketing system being integrated with sales data for that region from the sales system to determine how that advertising has impacted sales or data a local council holds in its housing system on antisocial behavior may be integrated with police data on crimes, with standard demographic data and with OFSTED report scores and schools data on referrals of pupils to identify predictors of future antisocial behavior and crimes.

  6. Data is important to a business because it can improve decision making and productivity. Discuss and explain 2 additional reasons that data is important to a business.
    Businesses can use data for a number of different purposes other than reports for decision and productivity support.  Key ones are transaction processing and in time monitoring. 

    Most transactions a business performs will involve data in some way.  If a customer places an order, past data about that customer may be retrieved such as their address, their credit limit &c.  The stock levels of the items they order will also need to be checked to ensure that there is stock to fulfil the order and that may trigger a replenishment request if the stock drops below a minimum figure.  The marketing system may also prompt them with other complementary products that people who bought what they are ordering now have often bought or if the product they want is out of stock what a suitable substitute might be. 

    In time monitoring is about the now and very recent past (typically seconds to days ago).  In IT this might be monitoring the physical status of servers to check the temperature and power consumption to identify any devices that are running hot or monitoring alert/error logs and escalating important messages or messages that have reached a threshold over a time period to a human operator for investigation.  The goal is to proactively identify future faults to allow preventative maintenance to be taken (a server that is running hot is more likely to fail in the near future, a disk that is throwing more than a certain number of errors in an hour may need to be replaced).  In a call centre this might be number of agents currently logged in, number of agents currently on calls, number of agents in wrap up, number of agents available, number of callers in queue, average time in queue for the past hour and past 4 hours, average call duration, longest current call and similar metrics.  This will be used by the floor supervisiors to manage load, redistribute staff from back office to call handling or visa versa, if a call is well over the expected duration then check on the agent to see if they are having problems and similar minute to minute controls.  Transport and logistics companies are increasing using GIS tracking of vehicles to support real time management of services.  Examples of this include bus companies tracking buses to provide arrival time data to schedule boards in bus stops, companies such as Uber and Ola routing requests for journeys to the nearest driver and Google monitoring the locations of Google Maps users in real time to determine if they are travelling, by what means and their speed so as to provide congestion information to other users so they can be directed around bottlenecks.
  7. One of the challenges of a data integration project can be combining data from incompatible sources. However, another challenge is getting the analysis of the requirement correct. This can be a complex task of identifying and documenting both the functional and non-functional requirements. The functional requirements gathering process focuses on product functionality, capability, features, and usability whereas the non-functional requirements gathering process encompasses all other factors not connected to a product’s functionality such as performance, security, or technical specifications.
    1. Provide 3 questions that should be answered when gathering functional requirements
      What are you looking to achieve?
      What is your business process that the product will be used in, where are ther touch points?
      What does your current solution not do that you need it to do?
    1. Provide 3 questions that should be answered when gathering non-functional requirements
      How quickly do you need the solution to respond to transactions/produce the report?  What’s your optimal target and what’s your worst acceptable case?  (The business may want immediate response but not be prepared to pay for it)
      What if any legal or regulatory restrictions does the solution need to comply with?
      In the event of a catastrophic system failure what downtime can you tolerate?  What is your optimal target and what’s your worst acceptable case?  (Again, the business may want zero downtime and no transaction loss, but they may not be prepared to pay for it).

Suggested websites

https://www.dataintegration.info/data-integration

PowerBI, what if you have multiple date fields

In Microsoft Power BI (or Power Pivot in Excel) if you want to work with dates then you will usually need a Date table. Date sliders and the date based DAX functions rely on there being a date table linked to fields you want to work with. But what if your data has multiple date fields in the same table that you might want to use? For example order data might have date order recieved, date order dispatched, date payment due, date payment received and a number of other dates associated with it (e.g. date account put into debt managenent). Similarly project task information may have date created, date due, date started and date completed.

In the data model you can only have one active relationship between two tables, including where there is an implicit relationship via an intermediate table, and you can only have one date table, so what do you do if you have multiple date fields you wanrt to use? The answer is references.

A reference is a query that takes as it’s input the result of another query. You can then use the data as is or apply further changes, this is useful where you might want to carry out different transformations on the same initial data and there are initial steps common to all of the transformations. As a reference takes the output of the other query, if you make changes to the original query they are carried through into the reference. If you want to copy a query and not have later changes to the original carried through into the copy then use the Duplicate option.

Image showing right click menu on a query in PowerQuery with Reference highlighted

One slight downside to this method is that you have to create the date table outside of the Power BI file and then read it in.

When you create them the reference queries will be named the same as the original query with a number on the end, e.g. a reference on Dates may be called Dates (1). Generally it would be best to rename them to match the name of the field they will be linked to so the reference query that will link to Created Date might be renamed to Created Dates. Good practice would be to create a reference for every date field that might be needed and not reuse the original date query. This reduces the risk of accidentally making changes to the original query that might have a knock on effects on the reference queries.

Once you’re done, close and save your Power Query window then in Power BI confirm that your originakl query of marked as the Date table and thne go to the relationships view and create your relationships:

Relationship view showing date reference tables and relartionships

As we can see here each refererence query is named for the field it will connect to and the relationship has been created. The original query (Date) is shown but not linked to the data table at all.

Excel vs ISO date format

Our team manager has decided that we should use Trello to manage our work on a project. There does not seem to be any out of the box MI reporting in Trello, not the free version at least, so he asked me to look at if we could report using Excel ‘or something’. You can export your board as a JSON file on the free version (if you get the business package you can export to CSV as well). Since right now my only knowldge of JSON is how to spell and pronounce it. I tried just sucking it into PowerBI but that only produced one row. Same happened with Excel so I guess it’s a PowerQuery ‘feature’.

I found some sites that will convert JSON to CSV or XLSX but most of those didn’t suit. JSON it turns out is hierarchical so that one row PowerQuery was producing was just the ‘left most’ entry and it was ignoring all further ‘child’ elements. The JSON to CSV converters did return all the elements b ut most retained the hierarchy so only the first row had all of the columns populated so PowerQuery only recognised that row.

I did find one site, Konklone, that will populate all columns so went with that.

Trello exports it’s dates in ISO 8601 format which Excel doesn’t know what to do with. After some digging and experimentation I found that the best way was to create a calculated column using the datavalue() and left() and mid() functions like:

=DATE(LEFT([@Cdate], 4), MID([@Cdate],6,2), MID([@Cdate],9,2))

to keep the time portion you can use:

=DATEVALUE(MID([@Cdate], 1, 10))+TIMEVALUE(MID([@Cdate], 12, 8))

This, of course, ignores the timezone element and gives the time in Coordinated Universal Time (UTC) but since UTC is synonymous with Greenwich Mean Time, we are in the UK and are unlikley to be that bothered about the time element that’s not a problem for us. Worth remembering for future reference though.

Exercises for BCS L4 Apprenticeship in Data Analysis

I’m doing a Level 4 qualification in data analysis and the training providor recently sent me a set of exercises to help prepare for an exam I’ll have to take at some point. The idea is to web research the questions then fill in the answers. This is the first batch.

Exercise 1a

  1. What is Raw data? provide at least one example.  Collected data that has not been processed in any way, data that is substantively as it came from the source.  An example of this might be the output from sensors in a building or area or the results of a survey.
  2. What is Processed data? provide at least one example.  Data that has been changed through processing from the source.  This might include merging with other data sets, summation or categorization.  An example of this might be taking the output from a number of sensors over a period of time which includes the ID of the sensor, the time of the reading and the value returned.  That dataset might be merged with a geographical dataset that maps the sensor ID to the location of that sensor, the dataset might then be summarized to the average value for a certain period of time (e.g. the sensor produces a reading every minute but you only need the average for each half hour) and then categorized (e.g. “Much to high”, “Somewhat too high”, “OK”, “Somewhat too low” and “Much too low”) based on the value with the category added as an extra column.
  3. Provide examples of CSV, XML, RTF and TXT Files? [Not 100% sure what this question is asking for] 
    CSV stands for Comma/Character Separated Variable.  These are structured files where each line typically represents one record made up of alphanumeric variables separated by a specific character (often a comma but can be a tab, pipe, slash or other character).  CSV data is typically easily mapped to a database table or spreadsheet as field identity is order based so the first variable is that between the start of the line and the first comma (or whichever character is used) the second variable  is that between the first comma and the second &c.  CSV is the default data export format for many commercial systems as it is non-propriety and widely supported. 
    XML stands for eXtensible Markup Language and is an implementation of Standard Generalised Markup language (SGML).  These are structured files and use tags enclosed in the less-than (<) and greater-than (>) to denote fields.  Each field can have a value (between the tags) and an attribute (key-value in the opening tag).  The structure of an XML file is defined by its schema, usually stored as a separate XML file, which can be used to validate the structure of the file.  XML can be hierarchical so a record can represent something that in a relational database might require multiple tables, e.g. invoices that would have separate tables for the Invoice Details and the Line Items Details in separate tables joined on Invoice Number. 
    RTF stands for Rich Text Format.  These are typically unstructured files, although it may be possible to infer structure from the visual appearance/format, e.g. the block of text in the top right corner is an address, text in a certain font is a heading and alphanumerics organized visually into rows and columns divided by straight lines are a table.  They may also include image data.
    TXT stands for TeXT or Plain Text.  These can be structured or unstructured.  CSV is one example of a structured text file, another common example is Fixed Width where each field has a specific width (so the first field might be the 1st to 10th characters, the second the 11th to 15th &c) and if the data in a record for that field is less than that width it is padded with spaces to that width.  Unstructured text files can be any text data such as that extracted from a letter/email, a blog post, a web page, a PDF document, a book, a magazine article &c.  As described with RTF it may be possible to infer structure from the visual formatting (although many of the cues such as font, justification, graphical lines &c will be missing).
  4. What does data transformation mean?  Data transformation is any processing that changes the data or it’s arrangement.  This may include summarization, removal of unneeded fields, filtering, normalization, denormalization, cleansing, categorization or the creation of calculated fields.  A common form of transformation is to take data from a transactional system that is in 3rd Normal Form across many tables (optimized for many small transactions and data integrity by storing each data item only once and using key references) and denormalise to a star schema with most of the data in a single table (where the same data item may appear in multiple records) with small dimension tables linked to it by key references.  For example a transactional order processing system may a have tables for customer details (account number, name, salutation, date of account created &c, maybe flags for if their account live or inactivated, if they are in credit management, credit limit &c), addresses linked to customer details by the customer account number (customer account number and the address, maybe also a flag for if it is a live or old address and a notes field for any special conditions for deliveries such as needing to call ahead or that the location doesn’t have a loading dock or goods lift) and an orders table that contains the details of each order and links to the customer details table for the customer details via the account number and the addresses table for the delivery address via an address reference.  One customer may have one or more addresses and each address may have zero or more orders delivered to it but each order will have one and only one customer and one and only one delivery address.  Whilst good for transactions creating and looking up single orders the join cost (processing time) for running reports on this data would be very high so for the reporting solution these tables would be merged to produce a single record for each order with all of the details for each order in one record (row).  The join cost is taken upfront in the transformation process so it doesn’t need to be taken every time a report is run.
  5.  What are the stages of the ETL process/ What is the ETL acronym short for?  Extract, Transform and Load.  Extract from the source system.  Transform to better suit the intended purpose.  Load into the reporting system.

Exercise 1b

  1. How do the types of data below differ regarding quality, availability and privacy?
  2. Open/public data? Typically anonymized and may only deal with summaries rather than the raw data so no privacy concerns, unless there’s a problem with the anonymization process.  Often published on the web (e.g. https://data.birmingham.gov.uk/) but older datasets may be on physical media in archives, typically free to access with no checks.  Quality is highly variable, some can be very high quality with a full spectrum to so poor quality that it is effectively useless.  As this data cannot be sold for profit the producers often will not expend much effort on documentation, quality checking &c.  If the data has to be published by law/regulation then the producer may deliberately obfuscate it to make it hard to use, common strategies (especially where it is published regularly) are to change the column order, add new colums and remove others, change units (e.g. one month report a currency in pounds, the next pennies and the one after in Euros), or rename columns.
  3. Propriety data? Typically this data is only available for purchase and will often include personally identifying information so there may be privacy issues and the need to show compliance with the GDPR.  Common examples of propriety data are marketing contact lists and survey responses.  As the dataset are usually the property of an organization there may be license restrictions on their use.  Availability tends to be good, datasets are generally sold to anyone prepared to pay, unless the data is from a commissioned survey in which case it may only be available to the commissioning body.  Quality is highly variable, especially marketing contact lists which are frequently out of date.  Of particular note is a list still in circulation that was stolen by a disgruntled employee from Experian in 2004 which contained a lot of ‘dirty’ (incorrect) data and sold by them to several aggregators of such lists.  A number of customers of these aggregators then sold on lists based on that list, with the ‘dirty’ data.
  4. Operational data? Operational data is any data that an organization collects as a consequence of it’s day to day operations.  Common examples are sales/orders data, HR information about it’s employees, production data and customer feedback.  It can also include research into competitors and their market.  Generally the data is only available within the organization that produced it, although some may be provided to external bodies such as regulators or used in producing public reports.  Operational data may be commercially confidential or include personally identifying information so there are often privacy concerns and the need to show compliance with the GDPR and other regulations.  Quality will typically be high as the potential for impact on the running of the organization means that any errors will usually be visible quickly and the potential for impact on the business of the organization mean that senior management will usually be willing to invest in data cleansing and efforts to ensure that the error rate in collection is low.
  5. Administrative data? Administrative data is collected by government and similar bodies through their day to day activities.  Some of the data may be published (possibly after anonymization) so be open data whilst other data may be subject to restrictions so availability can be variable, as can privacy concerns.  Quality of administrative data tends to be proportionate to the cost of poor quality to the body or team who collect it.  Examples of administrative data include the electoral roll, taxation returns, service performance monitoring statistics and financial transaction records.
  6. Research data? Research data can be the result of an academic research project, market research surveys, clinical trials, product research or any programme of targeted research.  Availability will depend in the source, typically academic research data will be freely available to assist with peer review and verification.  Elsevier (an academic publisher and data analytics company) provide, through their Mendeley product, a portal for researchers to share raw data with other researchers.  Following the 1964 Declaration of Helsinki, complete data relating to clinical trials must be publicly available with only personally identifying information of participants redacted.  The reach of the Declaration of Helsinki, and the strictness with which it is enforced, was largely driven by revelations of data being hidden by executives at Chemie-Grünenthal about the teratogenic side effects of Thalidomide.  Other research data may only be available to the organization that carried out or commissioned the research.  Academic research is typically subject to ethics panels which have as part of their remit to ensure privacy of participants, privacy of clinical trial participants is required under the Declaration of  Helsinki and often further enforced by national laws on medical privacy.  Market research data privacy is typically just covered by local laws on data protection and voluntary codes of practice.  Quality of academic research data tends to depend on the researcher but, particularly in the Natural Sciences, the need for repeatability of results tends to surface any issues quickly.  Clinical trial data quality has to be high as the penalty for poor data quality can be very high, both financially and reputationally.  Market and product research data quality can be highly variable depending on the body carrying out the research, street survey data is particularly suspect as stories of researchers sitting in cafes and pubs to fill out surveys themselves to get their numbers up abound.  One also needs to be aware that research is often undertaken to answer a specific question or to achieve a particular answer so trying to use that data for another purpose may lead to erroneous results due to unstated assumptions in rthe research.  Political surveying often produces very low quality data as many research companies will target the demographic groups that will give the answer their customer wants so that that customer will come back again.  This has led to observations on social media that “Political surveys are not done to canvass public opinion but to shape it”.
  7. Enterprise data? Enterprise data is the data shared across a large organization, across it’s multiple business units and locations.  It can include all of the previously discussed types of data.  Data will be gathered from operational systems (sales, manufacturing, customer support &c), the ERP (Enterprise Resourcing and Planning) systems (Finance, HR, CRM &c), marketing surveys, published third party surveys and other sources, which can include scaping and analysis of social media feeds, news articles and customer emails.  Availability of the data is typically restricted to the organization itself, although in many large organizations that lack a strong corporate culture of openness and sharing departments may resist sharing ‘their’ data.  In the mid-1990s a Swiss based pharmaceutical company ran into issues as their Eastern Europe and Asia sales team and their Western Europe, Middle East and North Africa sales team refused to share data and treated each other (and the other sales teams) as competitors.  It took the intervention of the board and several senior management dismissals to resolve the issue and may have been a major factor in the company being acquired by Novo Nordisk a few years later.  Since the data typically remains within the organization privacy concerns are reduced, but (in light of GDPR and similar regulations) care must be taken to ensure that the processing is compatible with the stated purpose of collection and the storage is located lawfully.  Quality is subject to the constraints previously discussed for each class of data but can be drastically improved by creating ‘Gold’ repositories for common data elements, such as customer addresses, with robust processes for keeping it up to date and key mapping to operational systems.  This is particularly an issue for local councils and other bodies where there are multiple possible touch points for citizens and, whilst the organization may see different departments with their own systems, the customer sees only one organization.  The use of fuzzy matching and machine learning can be very valuable in this to identify possibly linked records in different systems.

Exercise 1c

  1. Describe Quantitative data Quantitative data is typically numerical and represents, as the name suggests, the quantity of something.  It can be used in calculations and often represented visually as a graph or chart.  When using quantitative data in calculations care must be taken to ensure that only appropriate calculations are done and that the data is in fact quantitative in that context, not everything that looks like a number is a quantity or indeed a number (e.g. a product code).
  2. Describe Discrete Quantitative data Discrete quantitative data is data which is constrained to specific values.  For example, when buying sugar at the supermarket, bags of sugar is discrete because you can only record in units of one bag, you don’t buy a fractional bag of sugar.
  3. Describe Continuous Quantitative data Continuous quantitative data is data which can have any value, typically within a range, limited only by your ability to measure it.  Returning to the sugar example, if you are buying loose sugar by the kilogram you can have any fractional amount of a kilo down to the level of precision of your scales, you are not limited to the units of the weight of one bag of sugar.

    Another example of the difference might be tailor made vs off the peg clothing.  People come in a variety of sizes so could have a, say, chest measurement anywhere in a wide range including fractions of an inch (clothing in the UK is still mostly measured in inches, where a standard measure is used rather than ‘dress sizing’ or arbitrary ‘T-shirt sizes’) and a tailormade shirt or blouse can be made to fit that exact measurement.  Off the peg shirts are typically only produced in set sizes so someone with a chest measurement between 30 and 32 inches (continuous quantitative data) will buy a 32 inch chest shirt (discrete quantitative data) as there are no shirts between 30 and 32 inches.
  • Describe Qualitative data Qualitative data is typically non-numeric and refers to a characteristic or non-quantity aspect of the subject.  Examples might include sentiment analysis of text, colour, size  (in particular ‘t-shirt sizing’), language, nationality, ethnicity, complexity &c.
  • Describe Binominal Qualitative data [I’ve not come across this before and really struggled to find any online references, this is based on what I was able to infer from what I did find, references I found were academic papers and assumed that the reader was already familiar with the term]  Binomial Qualitative data denotes where the data item depends on another data item about the same entity or from that data item (perhaps with another) the one or more others can be inferred.  For example, for someone to be buried in a grave their vital status should be ‘dead’; if someone’s role in a family is ‘Father’ then you can infer that their gender is ‘Male’ and that they have one or more children.  In linguistics the term can also refer to a phrase that identifies an entity as being in a subset of a larger group so “Pike, you stupid boy.” Tells us that the entity Pike is male, stupid and young (or at least younger than the speaker).  Care must be taken with not over stretching inference as someone being a ‘Father’ does not tell us if the child(ren) is/are their biological offspring, adopted, from a past relationship of their partner or some other connection.
  • Describe Nominal Qualitative data Nominal data denotes a classification that is not objectively related to rank.  Examples include colour, flavor, ethnicity, gender, location etc.
  • Describe Ordinal Qualitative data Ordinal data denotes a ranking.  Examples include T-shirt sizing, rank/position (first, second, third &c), qualification grading (A is better than B is better than C &c), pricing band (Luxury, Standard, Basic and Value), etc.  It may be based on quantitative data (e.g. the team that wins the most games is first in the league, the team that wins the next most will be second &c) or not (e.g. subjective judgement of flavor and presentation in a cooking competition).

Most common issue I’ve found is that some of the terminology is non-standard.

Disappointed in Course Materials

As part of my apprenticeship I’ve been provided with access to course matertials on UCertify. I’m seriously worried at the poor quality of the materials. Lots of typos, grammer issues and spelling issues, plus both the matertials and the quizes reference online technologies that have now been removed by the supplier (and one that may never have existed). I’ve raised this by email with my learning co-ordinator but not had a response yet. I have a Teams meeting with him set up for Monday, I’ll raise it then.

Character Vectors and Factors

Dipping back in to “Statistics for Linguists” by Bodo Winter for a bit.

Example given is gender <- c('F', 'M', 'F', 'F'), apparently you can use either single or double quotes. When you execute a call to gender to display it on the console then R responds with double quotes.

You can use class(gender) to confirm that this is indeed a character vector and address elements individually using the square brackets notation as you can with numeric vectors so gender[2] returns "M". You can also use logical statements in the square brackets, which Bodo mentions like it’s been said before but I don’t recall it being. Anyhow, gender[gender == 'F'] returns the three elements that are F, I’d have thought it would be more useful to return the indices of those elements so if you had a matching vector of the names you could use something like names[gender[gender=='F']] to get the corresponding elements in names for those in gender that are F. I tried this and it just returned the first element of names three times. To do that you can use names[gender == 'F'] which works but seems less clear.

Next we’re introduced to factors, but not what they are. gender <- as.factor(gender) converts the vector gender to a factor. The key change seems to be that when you display the vector on the console R doesn’t put the letters in quotes and returns an additional line that reads Levels: F M. From the description it looks like the values are tokenised. The levels() function displays the valid levels for the vector and if you try to replace a value with a different one that isn’t a valid level, e.g. gender[3] <- 'not declared', then you get an error message and the element is repalced with NA. If you need to add a new level you can do so using the levels(function) and the c() function to populate it, levels(gender) <- c('F', 'M', 'not declared'), then you can do your gender[3] <- 'not declared'.